
There are two types of replica: Leader replica and Follower replica. Let’s say that there are three replicas of a partition. One of them, should be a leader. All the requests from producers and consumers would pass to the leader in order to guarantee consistency. All the replicas other than the leader are called follower. Follower do not serve any request and their only task is to keep themselves updated with the leader. One of the follower replicas become the leader in case the leader fails. The process where the data from the leader is fetched to the replicas is called replication. Please go through the article here, if you wish to read more about Kafka internals.
Replication is the core of Kafka.
If replication is not happening, in case of leader failure, we will not have a follower which can be made leader cleanly. It’s going to lead to inconsistency in data. So, how do we make sure that our partitions are not under replicated.
Fortunately, Kafka exposes JMX metric that can tell us if our replication is well behaving or not. We can expose these Kafka metrics to prometheus and set up an alert. This article will briefly discuss what are the potential reason for under replicated partitions and how to debug and fix it.
JMX Metric Name
kafka.server:type=ReplicaManager,name=UnderReplicatedPartitions
This is the one must have metric that should be monitored. This metric provides us a count of the follower replicas that are not caught up with the leader replica which are present in a particular broker. This metric is provided for every broker in a cluster. This single measurement provides insight into a number of problems with the Kafka cluster, from a broker being down to resource exhaustion.
How to debug under replicated partitions?
Broker-level problems
If any broker is down, all the replicas on it will not be synced up with the leader and you will see a constant number of under replicated partitions.
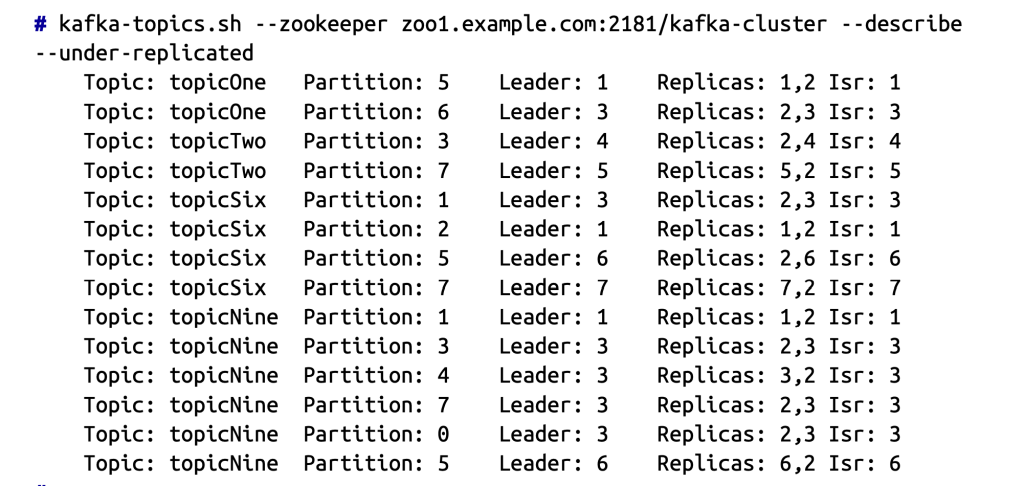
If the number of under replicated partitions is not constant, or if all the brokers are up and running and still you see a constant count of under replicated partitions, this typically indicates a performance issue in the cluster. If the under-replicated partitions are on a single broker, then that broker is typically the problem. We can see the list of under replicated partition using the kafka-topics.sh tool as shown in the picture below. We can now see the common broker as 2 in the list of the replicas that are under replicated. This means broker 2 is not working well.
Cluster-level problems
Unbalanced load
How do we define unbalanced load on a broker in a cluster? If any broker has dramatically more count of partition, or it has significantly more bytes going in or out with respect to other brokers in the cluster, then the load on that cluster can be considered as unbalanced. In order to diagnose this problem, We will need several metrics from the brokers in the cluster:
- Leader partition count
- All topics bytes in rate
- All topics messages in rate
- Partition count
Here’s an example shown below. The example shown below has a balanced cluster, as all the metrics are approximately same.

What if traffic is not balanced within the cluster and results in under replicated partitions?
We will need to move partitions from the heavily loaded brokers to the less heavily loaded brokers. This is done using the kafka-reassign-partitions.sh tool
Another common cluster performance issue is exceeding the capacity of the brokers to serve requests. There are many possible resources deficit that could slow things down. CPU, disk IO, and network throughput are some of those resources. Disk utilization is not one of them, as the brokers will operate properly right up until the disk is filled, and then this disk will fail abruptly.
How do we diagnose a capacity problem?
There are many metrics you can track at the OS level, including:
- Inbound network throughput
- Outbound network throughput
- Disk average wait time
- Disk percent utilization
- CPU utilization
Underreplicated partitions can be result of exhausting any one of the resources written above. It’s important to know that the broker replication process operates in exactly the same way that other Kafka clients do. If our cluster is having problems with replication, then our clients must be having problems with producing and consuming messages as well. It makes sense to develop a baseline for these metrics when our cluster is operating correctly and then set thresholds that indicate a developing problem long before we run out of capacity. We should also review the trend for these metrics as the traffic to our cluster increases over time. As far as Kafka broker metrics are concerned, the All Topics Bytes In Rate is a good guideline to show cluster usage.
Application-level problem
We should also check if there is another application running on the system that is consuming resources and putting pressure on the Kafka broker. This could be something that was installed to debug a problem, or it could be a process that is supposed to be running, like a monitoring agent, but is having problems. We can use the tools on your system, such as top, to identify if there is a process that is using more CPU or memory than expected.
There could also be a configuration problem that might have crept in the broker or system configuration.
Hardware-level Problem
Hardware problems could be as obvious as a server that stops working or it could be less obvious and it starts causing performance problems. These are usually soft failures that allow the system to keep running but in degraded mode. This could be a bad bit of memory, where the system has detected the problem and bypassed that segment (reducing the overall available memory). The same can happen with a CPU failure.
For problems such as these, you should be using the facilities that our hardware provides – such as an intelligent platform management interface (IPMI) to monitor hardware health. When there’s an active problem, looking at the kernel ring buffer using dmesg will help you to see log messages that are getting thrown to the system console.
Disk failure
The more common type of hardware failure that leads to a performance degradation in Kafka is a disk failure. Apache Kafka is dependent on the disk for persistence of messages, and producer performance is directly tied to how fast our disks commit those writes. Any deviation in this will show up as problems with the performance of the producers and the replica fetchers. The latter is what leads to under-replicated partitions. As such, it is important to monitor the health of the disks at all times and address any problems quickly.
A single disk failure on a single broker can destroy the performance of an entire cluster. This is because the producer clients will connect to all brokers that lead partitions for a topic, and if you have followed best practices, those partitions will be evenly spread over the entire cluster. If one broker starts performing poorly and slowing down produce requests, this will cause back-pressure in the producers, slowing down requests to all brokers.
If you are new to Kafka, please read the first two posts of the series given below.
Reference
If you liked this article and would like one such blog to land in your inbox every week, consider subscribing to our newsletter: https://skillcaptain.substack.com
